An electricity bill can tell you how much electricity a business used during a month.
Half-hourly electricity data can tell you when it was used.
That difference matters.
A commercial building might consume 30,000 kWh during one month, but the total alone does not show whether the electricity was used during normal working hours, overnight, at weekends or during a handful of unusually high-demand periods.
Half-hourly electricity data breaks consumption down into 30-minute intervals.
On a normal day, that gives 48 separate readings.
Put those readings together and you get something much more useful than a monthly total: a picture of how the building actually behaves.
That picture is usually called a load profile.
For facilities managers, landlords, energy managers and organisations operating several sites, the load profile can help answer questions that a bill cannot.
When does the building start consuming electricity in the morning?
How quickly does demand fall after people leave?
What is still running overnight?
Are weekends genuinely quieter?
Has a new piece of equipment changed the profile?
Is EV charging creating a new evening load?
Is one building behaving differently from the rest of the estate?
Half-hourly data does not answer every question automatically, but it gives you somewhere sensible to start looking.
What does half-hourly electricity data actually contain?
Half-hourly data records the electricity consumed during each 30-minute period.
A typical weekday might begin with low consumption overnight, followed by a rise when heating, ventilation, lighting and equipment begin operating.
Demand may remain relatively stable while the building is occupied, then fall again during the evening.
Instead of receiving one figure for the whole day, you see the individual intervals that make up that total.
For example:
- 00:00 to 00:30
- 00:30 to 01:00
- 01:00 to 01:30
and so on throughout the day.
On a normal 24-hour day there are 48 periods.
Over a year, that produces thousands of individual data points for a single meter.
The volume of data is much larger than a traditional meter-reading history, but that detail is precisely what makes it useful.
What is a half-hourly load profile?
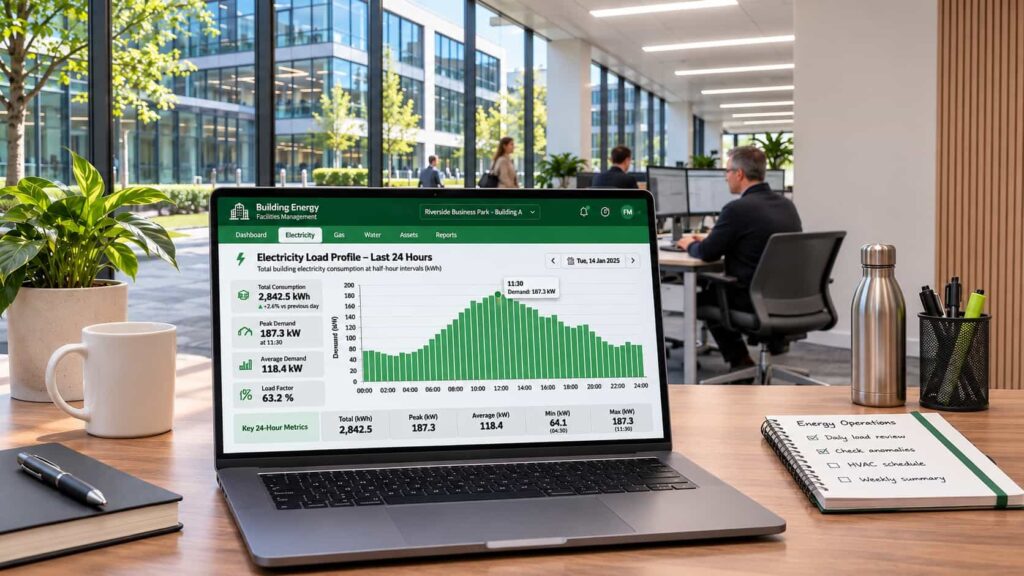
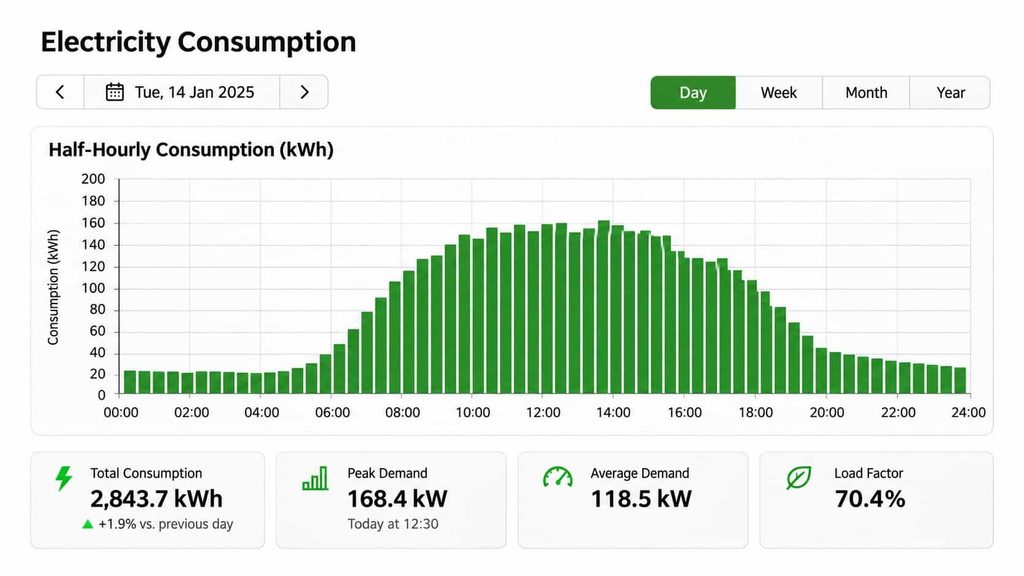
A load profile is simply a visual representation of electricity consumption over time.
Instead of staring at thousands of rows in a spreadsheet, the readings are plotted on a graph.
The horizontal axis normally represents time.
The vertical axis represents electricity consumption or demand.
Once the readings are presented this way, patterns become much easier to recognise.
An office might show a sharp rise at 06:30, even though employees do not arrive until 08:30.
A warehouse might maintain almost the same electrical load throughout Saturday and Sunday as it does overnight during the week.
A hotel may show a consistent 24-hour load but a pronounced rise during breakfast and evening periods.
A manufacturing site might reveal large peaks associated with particular production cycles.
The total electricity used still matters.
The shape of the consumption often tells you more about why it was used.
Why are there 48 readings a day?
Electricity consumption changes constantly.
A single daily or monthly reading hides those changes.
Dividing the day into 30-minute intervals provides enough detail to identify useful operating patterns without requiring somebody to analyse second-by-second electrical measurements.
Half-hourly intervals have also long been important within the British electricity market for metering and settlement.
From an energy-management perspective, though, the important point is simpler.
Forty-eight readings give you 48 opportunities each day to see when consumption changed.
That makes patterns such as morning start-up, daytime demand, evening shutdown and overnight baseload visible.
There can be exceptions around clock changes depending on how a particular dataset is provided, so anyone analysing exported data over long periods should also be aware of time stamps and daylight-saving adjustments.
Is half-hourly data the same as a meter reading?
Not quite.
A traditional meter reading usually tells you the cumulative amount recorded by the meter at a particular point in time.
Half-hourly consumption data normally represents the energy used during each interval.
That distinction can cause confusion when somebody opens a spreadsheet for the first time.
If an interval contains 12 kWh, that means 12 kilowatt-hours were consumed during those 30 minutes.
It does not necessarily mean the electrical demand was 12 kW.
If 12 kWh is consumed evenly over half an hour, the average demand during that interval would be 24 kW.
Understanding the difference between kWh and kW becomes particularly important when businesses begin investigating peak demand and electrical capacity.
Where does half-hourly electricity data come from?
The data may come from several types of metering arrangement.
A commercial property may have a half-hourly electricity meter associated with its incoming supply.
Another building may have an advanced or AMR meter capable of recording interval data.
Smart meters can also record detailed consumption information.
Inside the building, electrical sub-meters may provide similar interval readings for individual tenants, floors, distribution boards, plant or equipment.
The meter measures the electricity.
A communications system transfers the readings.
A data platform, energy portal or other software then stores and presents them.
For the person managing the building, what matters is having reliable access to the readings in a usable format.
What can half-hourly electricity data tell you?
The first thing it shows is when the building uses electricity.
That sounds simple, but it is often information businesses have never had in an easily usable form.
Imagine an office that operates from 08:00 until 18:00.
The expected load profile might show demand increasing shortly before employees arrive and falling after they leave.
Now imagine the data shows demand rising at 04:30.
Something is starting much earlier than expected.
That could be heating, ventilation, cooling, electric water heating, lighting or another piece of plant.
The meter cannot tell you which one.
It does tell you when to investigate.
The same principle applies throughout the day.
Half-hourly data can reveal overnight consumption
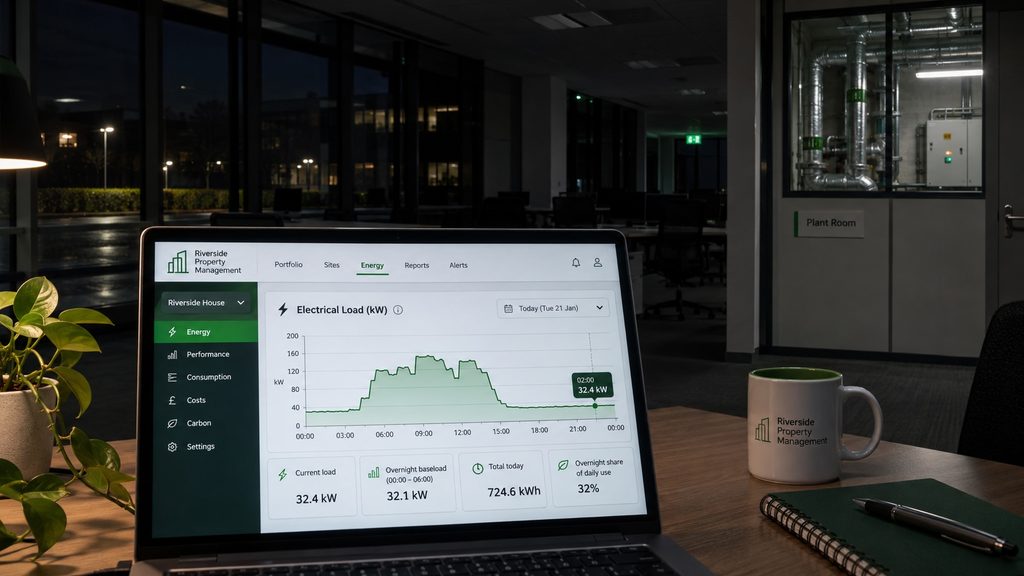
One of the most useful checks is to look at the building during the quietest hours.
For many commercial properties, this means somewhere between midnight and early morning.
Some electricity consumption will usually remain.
Servers, security systems, refrigeration, networking equipment, emergency systems and essential plant may need to operate continuously.
The question is whether the remaining load makes sense.
If an office consumes 60 kW during occupied hours but still draws 35 kW at 03:00, the difference between occupied and unoccupied demand is surprisingly small.
That deserves investigation.
You may find ventilation operating unnecessarily, cooling schedules that were never updated, lighting controls that have been overridden or equipment being left on permanently.
This minimum recurring demand is often referred to as the building’s baseload.
You can see how a building starts up
The morning rise can be equally informative.
Does consumption begin increasing 30 minutes before occupancy?
Two hours before?
Four hours before?
Buildings often have legitimate reasons for starting plant before people arrive.
Heating may need time to bring the building to temperature.
Ventilation systems may operate before occupancy.
The problem occurs when schedules no longer reflect how the building is actually used.
An office that once opened at 06:00 may now open at 08:00.
If the controls were never changed, years of unnecessary early-morning consumption can go unnoticed.
The load profile makes that behaviour visible.
You can see whether the building shuts down properly
A well-controlled commercial building normally shows some form of reduction after normal operating hours.
The speed and scale of that reduction can tell you a great deal.
If electricity demand remains almost unchanged until midnight, equipment may be operating long after occupants leave.
If demand falls initially but rises again later, scheduled equipment may be starting unexpectedly.
If Friday evening demand never reaches the normal overnight level and remains elevated throughout the weekend, something may have been left running.
These are difficult problems to identify from monthly invoices.
They are often obvious on a half-hourly graph.
Half-hourly data makes weekends easier to investigate
Weekend consumption provides a useful comparison because occupancy is often lower.
If a building is supposed to be closed but Saturday’s load profile looks almost identical to a weekday, there should be a reason.
Some businesses genuinely operate seven days a week.
Others have refrigeration, data centres or production processes that cannot be stopped.
But where there is no operational explanation, the weekend profile can expose unnecessary plant schedules and equipment left running.
Comparing weekdays, weekends and public holidays is therefore a useful part of energy analysis.
Look for changes rather than just high consumption
The most useful question is not always whether consumption is high.
It is whether something changed.
Suppose a building has maintained a consistent overnight load for six months.
Then, on 12 October, the load rises by 15 kW and remains at the new level every night afterwards.
That date is useful.
Facilities teams can investigate what changed around the same time.
Was equipment replaced?
Did heating controls change?
Was a new tenant added?
Did EV charging begin?
Was a manual override applied?
Did a fault occur?
Historic interval data can turn a vague increase in the electricity bill into a much narrower investigation.
Half-hourly data can help compare buildings
The value becomes even greater across an estate.
Consider an organisation operating ten offices.
Monthly electricity totals may differ because the buildings are different sizes.
Half-hourly profiles allow another type of comparison.
Which building starts earliest?
Which has the highest overnight load?
Which shuts down most effectively?
Which has unusual weekend consumption?
Which shows the greatest difference between occupied and unoccupied demand?
These comparisons can help facilities teams decide where to investigate first.
The goal is not simply to produce a league table.
It is to identify buildings whose behaviour does not make sense.
Can half-hourly data tell you which equipment is using electricity?
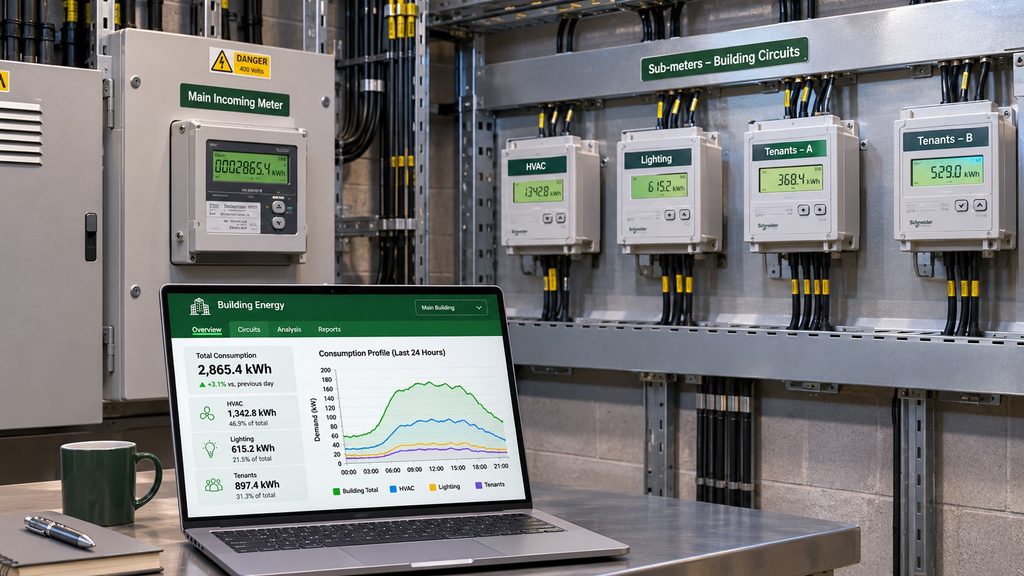
Usually not from the main meter alone.
This is an important limitation.
The incoming electricity meter may show that demand increased by 20 kW at 02:00.
It cannot necessarily tell you whether that increase came from ventilation, refrigeration, EV charging or tenant equipment.
That is where sub-metering becomes useful.
Electrical sub-meters can separate major loads such as:
- HVAC plant
- lighting
- EV charging
- tenant areas
- server rooms
- production equipment
- specific distribution boards
- renewable generation
The main half-hourly profile identifies when something changed.
Sub-metering can help identify where the change occurred.
Half-hourly data and energy monitoring
A spreadsheet containing thousands of readings is technically useful, but it is not always practical.
Energy monitoring platforms can turn the raw data into graphs, comparisons, reports and alerts.
Instead of manually searching for abnormalities, a monitoring system might flag that overnight consumption is significantly higher than usual.
It may show a meter that has stopped reporting.
It can compare similar sites.
It can track performance before and after an efficiency project.
It can also bring electricity data together with gas, water, heat and other building information.
The purpose is not to create more graphs.
It is to make the data easier to use.
Half-hourly data and AMR
Automatic Meter Reading and half-hourly data are closely related but they are not the same thing.
AMR describes the automated collection of meter readings.
Half-hourly data describes the interval at which consumption information is recorded.
An AMR meter may provide half-hourly data.
A smart meter may also provide half-hourly data.
A commercial sub-metering system may generate half-hourly readings internally.
For energy managers, it is worth separating the two questions:
How is the data collected?
How frequently is consumption recorded?
Both affect how useful the resulting information will be.
Half-hourly data and the changing UK electricity market
The British electricity market is increasingly making greater use of half-hourly consumption information.
For businesses, this reinforces something that energy managers have known for years: the timing of electricity consumption matters as well as the total quantity consumed.
More detailed data can support more accurate settlement, more flexible tariffs and better understanding of demand.
For individual commercial buildings, the immediate opportunity is much more practical.
If the information already exists, use it.
Do not treat half-hourly data simply as something collected for the supplier.
It can be one of the most useful diagnostic datasets available to a facilities team.
What should you check first?
If you have access to half-hourly electricity data, begin with a single normal week.
Look at the profile over 24 hours.
Identify normal operating hours.
Find the lowest overnight demand.
Check when consumption begins increasing in the morning.
Look at how quickly it falls in the evening.
Compare weekdays with Saturday and Sunday.
Then repeat the exercise for another month.
You are looking for patterns that make sense and, more importantly, patterns that do not.
Once an unusual period has been identified, investigate the building operations that coincide with it.
That simple process can often reveal more than analysing a year’s total consumption.
Frequently asked questions
What is half-hourly electricity data?
Half-hourly electricity data records consumption in 30-minute intervals. A normal day therefore contains 48 consumption periods, creating a detailed profile of when electricity is being used.
What is HH data?
HH data is simply a common abbreviation for half-hourly data.
What is a half-hourly electricity meter?
A half-hourly meter records electricity consumption at 30-minute intervals and is commonly used for commercial electricity supplies and energy monitoring.
What are the benefits of half-hourly data?
It can reveal operating hours, overnight baseload, weekend consumption, unusual peaks, changes in building behaviour and the effect of energy-efficiency work.
Can half-hourly data reduce electricity costs?
The data itself does not reduce consumption. It helps identify where waste or unusual demand may exist so the organisation can investigate and take appropriate action.
Does half-hourly data show individual equipment?
Not usually when the data comes from the main building meter. Electrical sub-metering may be needed to separate tenants, plant, equipment or other significant loads.
Is half-hourly data useful across multiple buildings?
Yes. Standardised interval data makes it easier to compare building behaviour and identify sites with unusually high baseloads, out-of-hours consumption or changes in demand.
From meter reading to useful information
The real value of half-hourly electricity data is not the number of readings.
It is the ability to see behaviour.
A monthly electricity total tells you what happened over a billing period.
Half-hourly data starts to explain when it happened.
Once you can see when demand rises, falls or refuses to fall, the questions become much more useful.
What is starting?
What is stopping?
What is still running?
What changed?
And where should we investigate next?
That is when electricity metering begins to move from billing information into practical building management.